Candlestick patterns have long been a fundamental tool for technical analysts in understanding market sentiment and predicting future price movements. Among these patterns, the Doji candlestick holds a unique place due to its ability to signify indecision or balance in the market. In this article, we will delve deeply into the structure, types, significance, and strategies associated with the Doji candlestick pattern.
What is a Doji Candlestick Pattern?

A Doji candlestick is a pattern that occurs when a security’s open and close prices are virtually the same, resulting in a thin or non-existent body. The candlestick typically has long wicks or shadows, signifying that prices fluctuated during the session but ultimately closed near the opening price.
The appearance of a Doji often signals indecision in the market, where neither buyers nor sellers are in control. This indecision could lead to a continuation or reversal of the prevailing trend, depending on the broader context of the chart.
Key Characteristics of the Doji Candlestick
- Small or No Real Body: The defining feature of a Doji is its minimal or zero body.
- Shadows (Wicks): The length of the upper and lower shadows can vary, but their presence indicates price volatility.
- Equal Open and Close: While the open and close prices do not have to be exactly equal, they are typically very close to each other.
- Market Indecision: The pattern reflects a temporary balance between buying and selling pressures.
Types of Doji Candlestick Patterns
There are several variations of the Doji pattern, each providing unique insights into market sentiment:
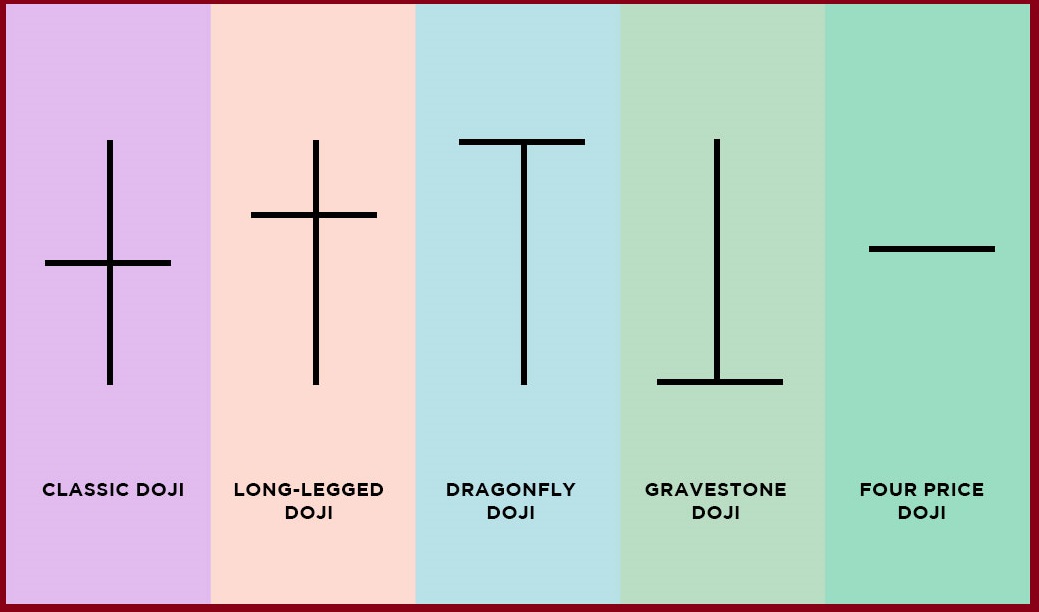
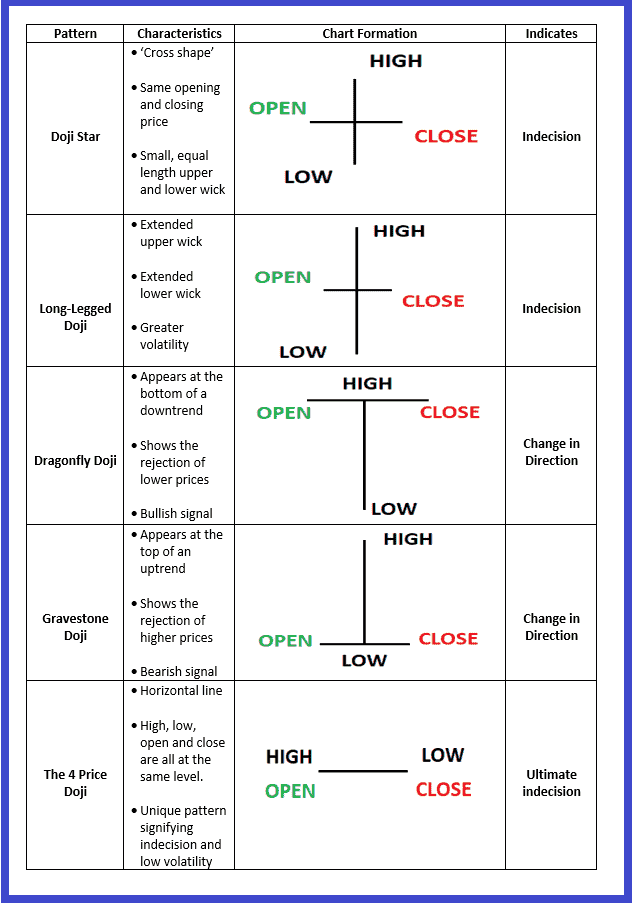
- Standard Doji
- The standard Doji has equal upper and lower shadows, representing complete indecision in the market.
- Long-Legged Doji
- This type features long upper and lower shadows, signifying significant volatility. However, the session still closes near the opening price.
- Gravestone Doji
- The Gravestone Doji has a long upper shadow and no (or very little) lower shadow. It suggests that buyers dominated early but lost control, leading to a close near the opening price.
- Dragonfly Doji
- The Dragonfly Doji has a long lower shadow and little to no upper shadow. This indicates that sellers were dominant initially, but buyers regained control by the session’s close.
- Four-Price Doji
- A rare type where open, close, high, and low are all the same. This reflects extreme indecision or a lack of trading activity.
Significance of the Doji Candlestick Pattern
The Doji pattern’s significance depends on its placement within the broader market context. Here are some key points to consider:
- Trend Reversal
- When a Doji appears after a strong uptrend or downtrend, it may indicate a potential reversal. This is because it reflects hesitation in continuing the prevailing trend.
- Continuation Signal
- In some cases, a Doji within a trend may signify a pause before the trend resumes.
- Confirmation is Crucial
- A Doji alone is not a definitive signal. Traders often look for confirmation from subsequent candlesticks to validate potential reversals or continuations.
Interpreting the Doji in Different Market Contexts
- In an Uptrend
- A Doji at the top of an uptrend may signal that buying momentum is weakening, potentially leading to a bearish reversal.
- In a Downtrend
- A Doji at the bottom of a downtrend might indicate that selling pressure is fading, paving the way for a bullish reversal.
- In Consolidation
- Within a sideways or consolidating market, a Doji suggests continued indecision, with no clear direction for the breakout.
Trading Strategies Using the Doji Candlestick
- Reversal Strategy
- Combine the Doji pattern with other technical indicators such as Relative Strength Index (RSI) or Moving Averages to confirm a reversal.
- Example: A Gravestone Doji at a resistance level with overbought RSI may suggest an impending bearish reversal.
- Breakout Strategy
- When a Doji appears in a consolidation phase, it could precede a breakout. Wait for a breakout candlestick to confirm the direction.
- Support and Resistance
- Use Doji patterns near key support or resistance levels to gauge potential reversals or breakouts.
- Fibonacci Levels
- Doji patterns at Fibonacci retracement or extension levels can reinforce the significance of these levels as potential reversal points.
Examples of Doji Patterns in Real Charts
- Standard Doji in a Trending Market
- A standard Doji after a prolonged uptrend might indicate profit-taking and a shift in sentiment.
- Dragonfly Doji at Support
- A Dragonfly Doji forming at a key support level can signify bullish strength and a potential upward move.
- Gravestone Doji at Resistance
- When this pattern appears at a resistance level, it’s often a strong bearish signal.
Limitations of the Doji Candlestick Pattern
- Not Always Reliable
- A Doji’s significance varies and is highly context-dependent. Misinterpretation can lead to false signals.
- Requires Confirmation
- Without additional confirmation, the Doji pattern alone is insufficient for making trading decisions.
- Frequent Occurrence
- Doji patterns can occur often, leading to potential overtrading if every instance is acted upon.
Tips for Trading with Doji Patterns
- Use Multiple Time Frames
- Analyze Doji patterns across different time frames for better insights.
- Combine with Volume Analysis
- Look for significant changes in volume to confirm the strength of the pattern.
- Incorporate Risk Management
- Always use stop-loss orders to mitigate potential losses from false signals.
Conclusion
The Doji candlestick pattern is a powerful tool for traders, offering insights into market sentiment and potential price reversals or continuations. However, its effectiveness depends on the broader market context and confirmation from other indicators. By understanding its nuances and integrating it into a comprehensive trading strategy, traders can leverage the Doji pattern to make informed decisions and enhance their trading performance.
Whether you’re a novice or an experienced trader, mastering the Doji candlestick pattern can provide a significant edge in navigating the complexities of the financial markets.

