The Hammer Candlestick Pattern: A Comprehensive Guide
The hammer candlestick pattern is one of the most popular and easily recognizable tools in technical analysis. It signals potential reversals in price movements, making it invaluable for traders and investors seeking to optimize their entry and exit points. This guide explores the structure, significance, variations, and strategies related to the hammer candlestick pattern.
What is the Hammer Candlestick Pattern?
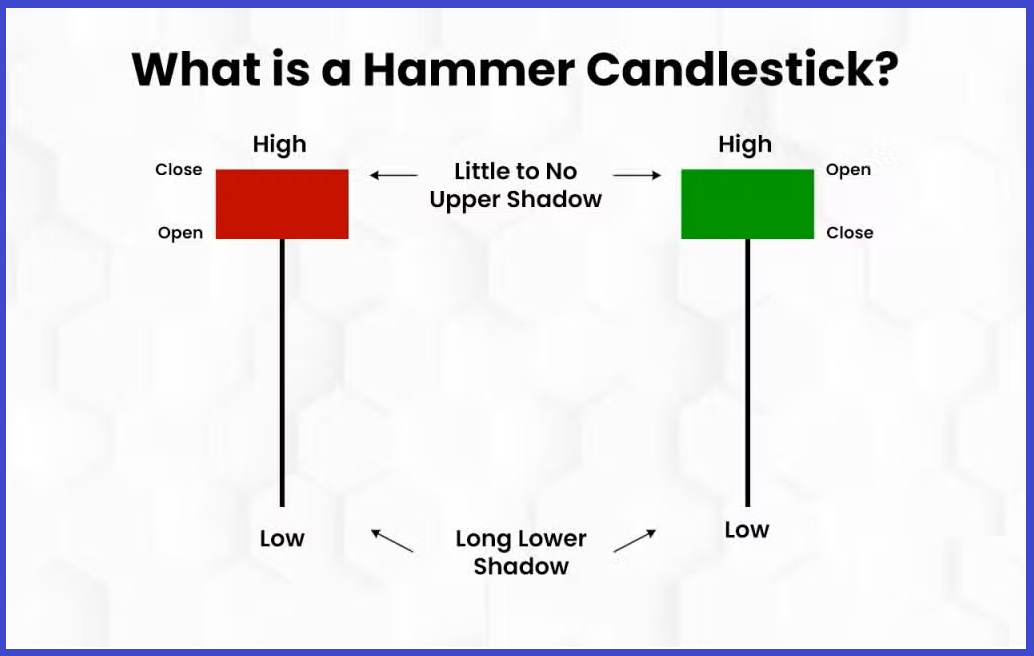
The hammer candlestick pattern is a single-candle formation that typically appears after a downtrend, indicating a possible bullish reversal. Its distinct appearance and implications make it a critical tool for technical analysts.
Characteristics:
- Small Real Body: Positioned near the top of the candle.
- Long Lower Shadow: At least twice the length of the real body, reflecting rejection of lower prices.
- Little to No Upper Shadow: A sign of minimal resistance from sellers.
- Color: Can be green (bullish) or red (bearish), though green hammers often have stronger implications.
Psychology Behind the Hammer
The hammer forms when sellers push the price significantly lower during the trading session, but buyers regain control, driving the price back up near or above the opening level. This dynamic demonstrates the potential weakening of selling pressure and an increasing likelihood of a bullish reversal.

How to Identify a Hammer Pattern
To confidently identify a hammer candlestick, ensure the following criteria are met:
- Preceding Trend: Must occur after a downward trend.
- Lower Shadow: At least twice as long as the real body.
- Real Body: Small and located near the candle’s upper end.
- Context: Check volume and other indicators to confirm the pattern’s reliability.
Types of Hammer Patterns
- Standard Hammer:
- Appears at the bottom of a downtrend.
- Signals a bullish reversal.
- Inverted Hammer:
- Occurs at the end of a downtrend.
- Has a long upper shadow and a small real body at the bottom.
- Suggests potential bullish reversal but requires stronger confirmation.
Hammer vs. Other Candlestick Patterns
While the hammer is similar to the hanging man and shooting star patterns, it stands out due to its positioning and implications:
- Hanging Man: Appears at the top of an uptrend, signaling bearish reversal.
- Shooting Star: Has a long upper shadow and appears after an uptrend.
Trading with the Hammer Candlestick Pattern
The hammer pattern is most effective when used in conjunction with other technical analysis tools. Here’s a step-by-step guide to trading the hammer:
- Confirmation:
- Wait for a strong bullish candle following the hammer to confirm the reversal.
- Entry Point:
- Enter the trade once the confirmation candle closes above the hammer’s high.
- Stop-Loss Placement:
- Place a stop-loss below the hammer’s low to manage risk.
- Target Price:
- Use resistance levels, Fibonacci retracements, or prior highs to set a target price.
Combining Hammer with Indicators
To enhance the reliability of the hammer pattern, use complementary technical indicators:
- Volume:
- Increased volume during the hammer formation strengthens its significance.
- Relative Strength Index (RSI):
- Look for oversold conditions to support the bullish reversal.
- Moving Averages:
- Check if the hammer forms near key moving average support levels.
Practical Examples
- Bullish Hammer Example:
- A stock in a downtrend forms a hammer at $50, with a long lower shadow reaching $45.
- The next day, a bullish candle closes at $52, confirming the reversal.
- Inverted Hammer Example:
- After a prolonged downtrend, an inverted hammer forms at $30.
- A strong bullish candle the following day closes at $33, signaling a trend reversal.
Advantages of the Hammer Pattern
- Simplicity:
- Easy to identify and interpret.
- Early Signal:
- Provides early indications of potential trend reversals.
- Widely Applicable:
- Effective across multiple timeframes and markets.
Limitations of the Hammer Pattern
- False Signals:
- Not all hammers lead to reversals; false positives can occur.
- Confirmation Needed:
- Requires a confirmation candle for reliability.
- Market Conditions:
- Less effective during choppy or sideways markets.
Common Mistakes When Trading the Hammer Pattern
- Ignoring Context:
- Always consider the broader market trend and volume.
- Overlooking Confirmation:
- Entering trades prematurely can lead to losses.
- Neglecting Risk Management:
- Always set a stop-loss to protect against adverse moves.
Conclusion
The hammer candlestick pattern is a powerful tool in technical analysis, offering traders an edge in identifying potential bullish reversals. While its simplicity and reliability make it a favorite among traders, it’s crucial to use it alongside other tools and strategies for the best results. By mastering the hammer pattern and integrating it into a disciplined trading plan, you can enhance your decision-making and success in the stock market.
